Where do the numbers come from?
Were the levels computed from the bars by ordinary code, or written by the model? If the tool cannot say, assume the model wrote them.
Purffle / Purffle Chartwright / Guides
Ask a chatbot where support is and you will get an answer — precise, confident, and sometimes a price the instrument never traded. Here is how to check any AI chart tool before you trust a number from it.
A language model writes the most plausible next words. Asked about a chart it cannot see, the most plausible answer is a round, confident price — and nothing in the model checks it against the bars. Compare two answers to the same question:
| A chatbot, asked the same question | An answer with computed figures |
|---|---|
| "Support sits around 1,360 with strong resistance near 1,400. A stop below 1,350 gives you a good risk-reward here." | "Support at 1,359.95 — the swing low of 12 Aug, retested four times since, held each time. ATR(14) is 7.03, so a stop there is 2.50 ATR below price." |
The first is fluent and unattached to anything. The second can be traced: which swing, how many touches, which volatility figure.
One question can be settled without predicting anything: is the price it just told you a price that
exists? The Chartwright benchmark held three small local models fixed — granite4.1:3b,
granite4.2:3b and qwen3.5:4b — and changed only whether the arithmetic was done first.
34 of the 72 prices given without chart data sat outside everything the instrument traded, against 0 of 38 once the computed analysis was supplied.
What it does not show matters as much: it is a small run — three instruments (NSE:RELIANCE 15m, BINANCE:BTCUSDT 1h,
AAPL 1d), two questions each — measuring one property. It says nothing about whether any tool makes money, and it is
not a comparison against frontier models: GPT, Claude and Gemini were not tested. The full tables are
on the Chartwright page, and the harness ships with the app as
scripts/benchmark.py.
Were the levels computed from the bars by ordinary code, or written by the model? If the tool cannot say, assume the model wrote them.
Pick any price it quotes and ask which bars produced it. A trustworthy tool shows its working.
A tool that always has an answer is guessing some of the time. "Not enough evidence" is a feature.
Look for a method you could re-run — not a testimonial or an accuracy percentage with no definition.
Watch for trade calls, promised win rates and order buttons. A tool that describes charts should not also be selling you trades.
Purffle Chartwright is a desktop chart analyst built around one rule: the model speaks last, and only about numbers it was handed.
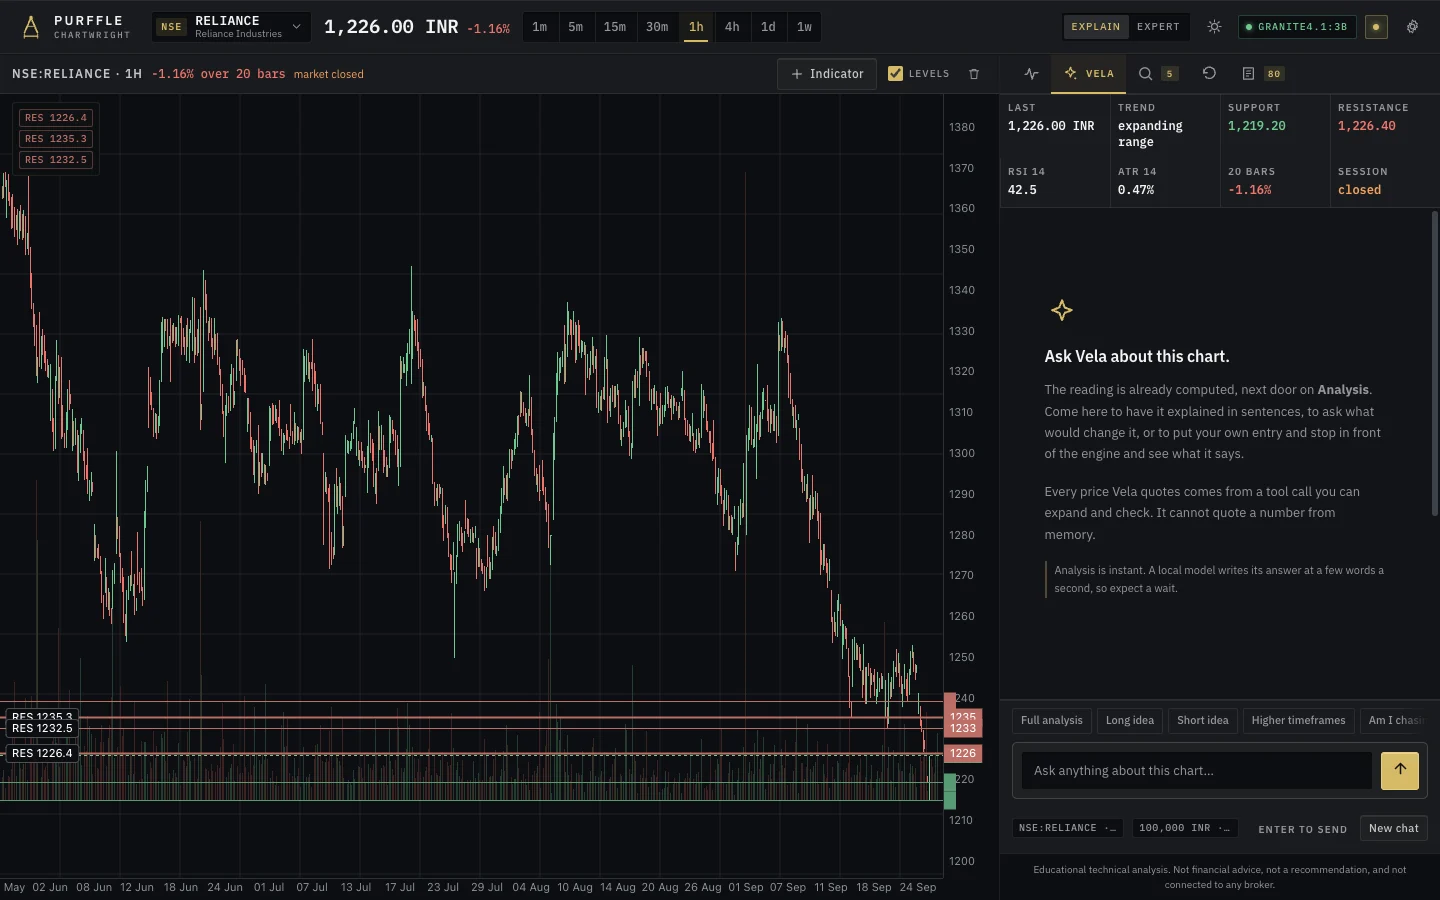
Grounding fixes the numbers, not the judgement: a model can still draw a poor conclusion from figures that are all correct. A local model is slow on a laptop CPU — minutes per answer on four cores without a GPU. Free market data can be delayed, gapped or adjusted. None of this forecasts price. The full list is in What Chartwright is not.