Directional agreement, scored
Seven independent checks — market structure, moving-average alignment, trend strength, momentum, room to the next level, support behind the trade, and volume — each vote logged with its reason. There is no hidden term.
Point it at any instrument and it computes the structure, levels, volatility and risk arithmetic in about 0.2 seconds — then hands it to a language model that is not permitted to invent a single figure. Every reading explains itself in plain English.
01 App tour · v1.0
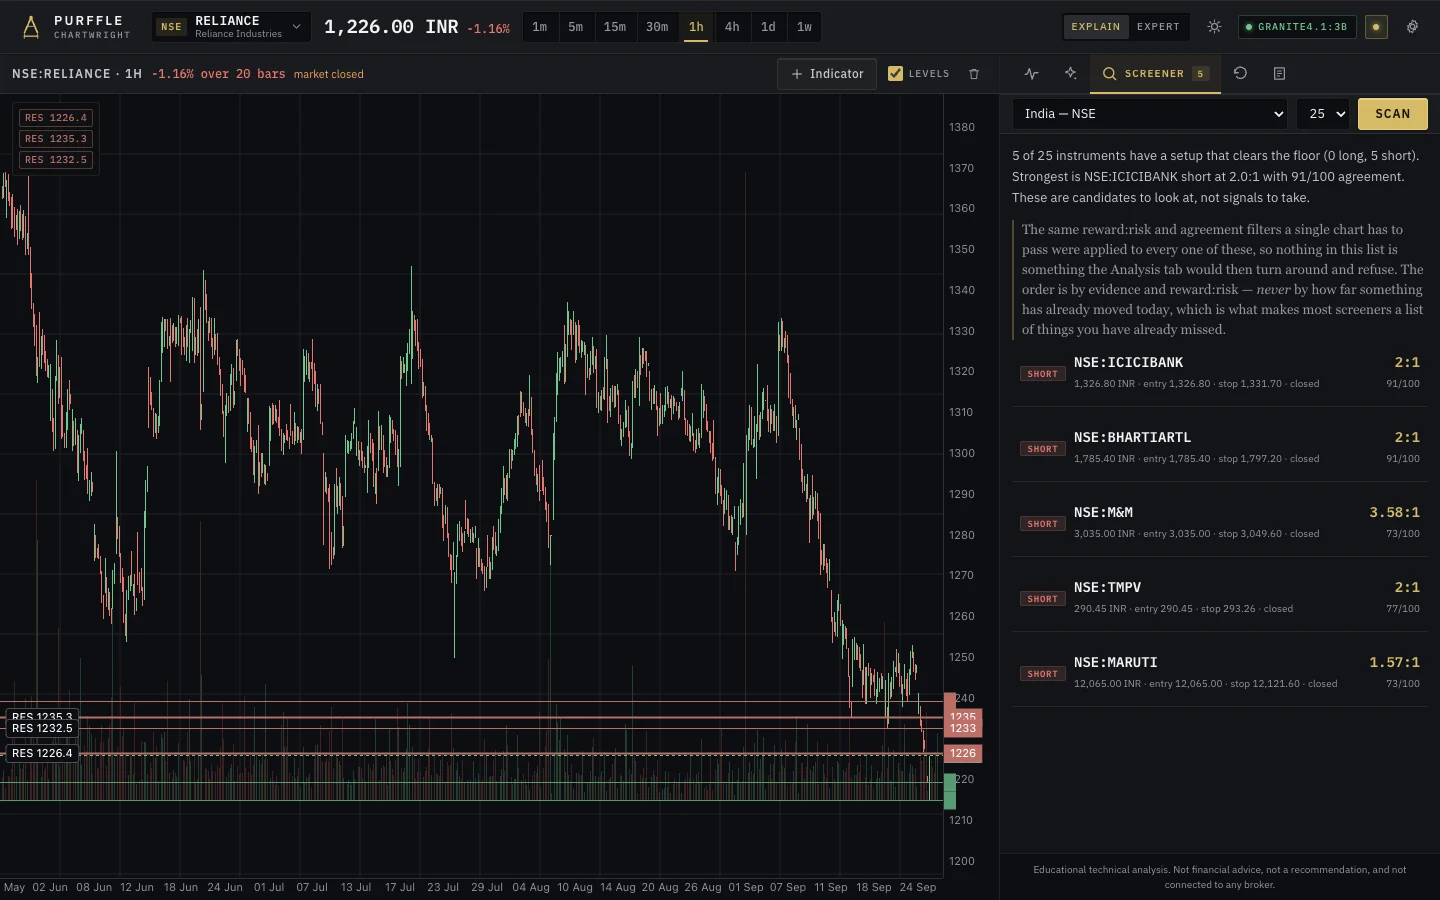
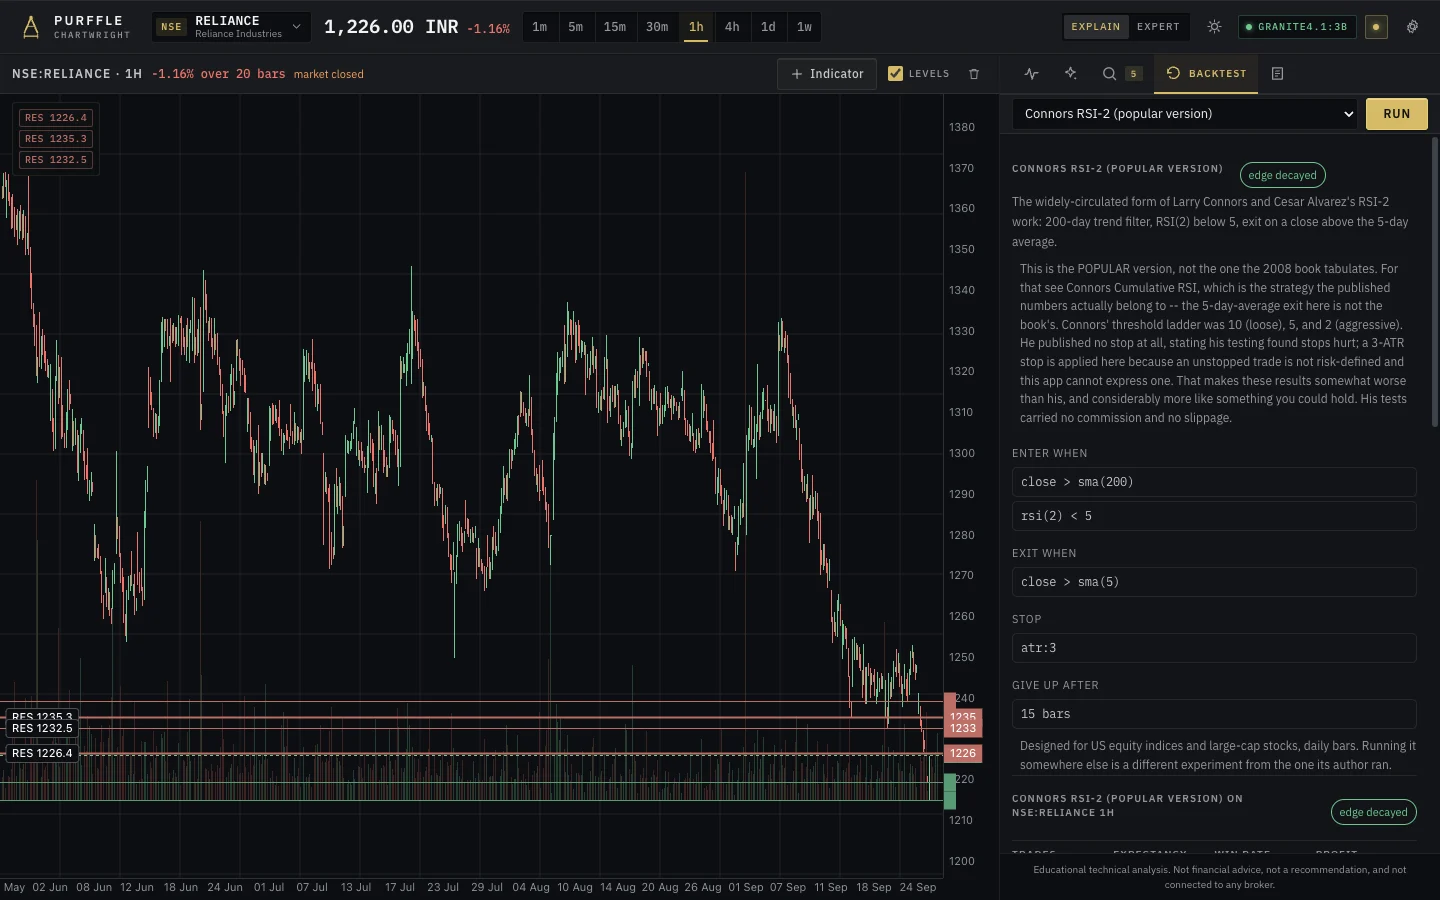
Real screenshots of Chartwright 1.0 on live NSE data, captured from the running app. Click any screen to see it full size.
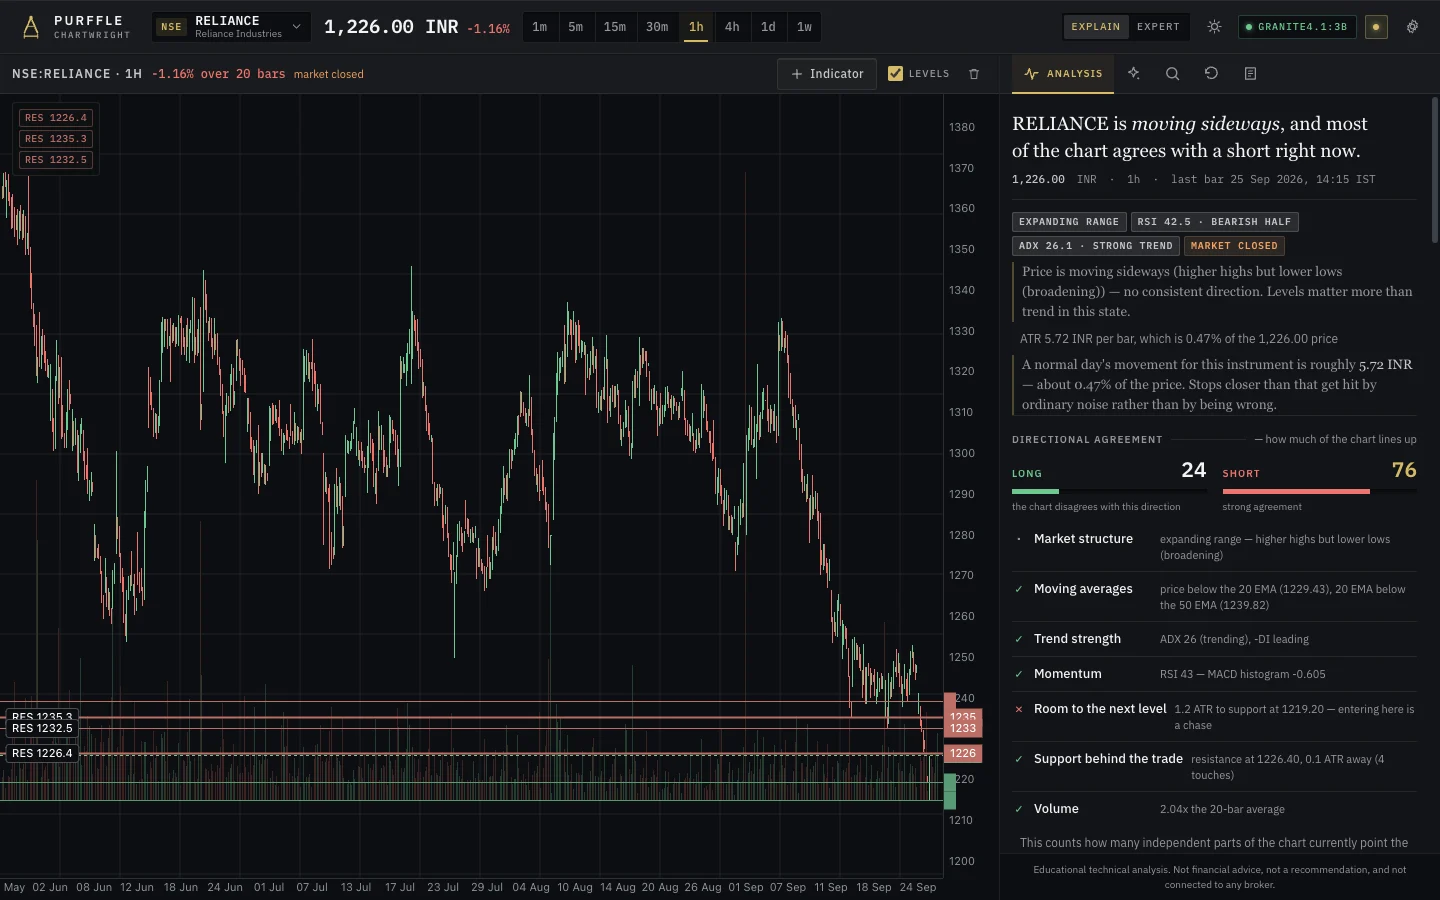
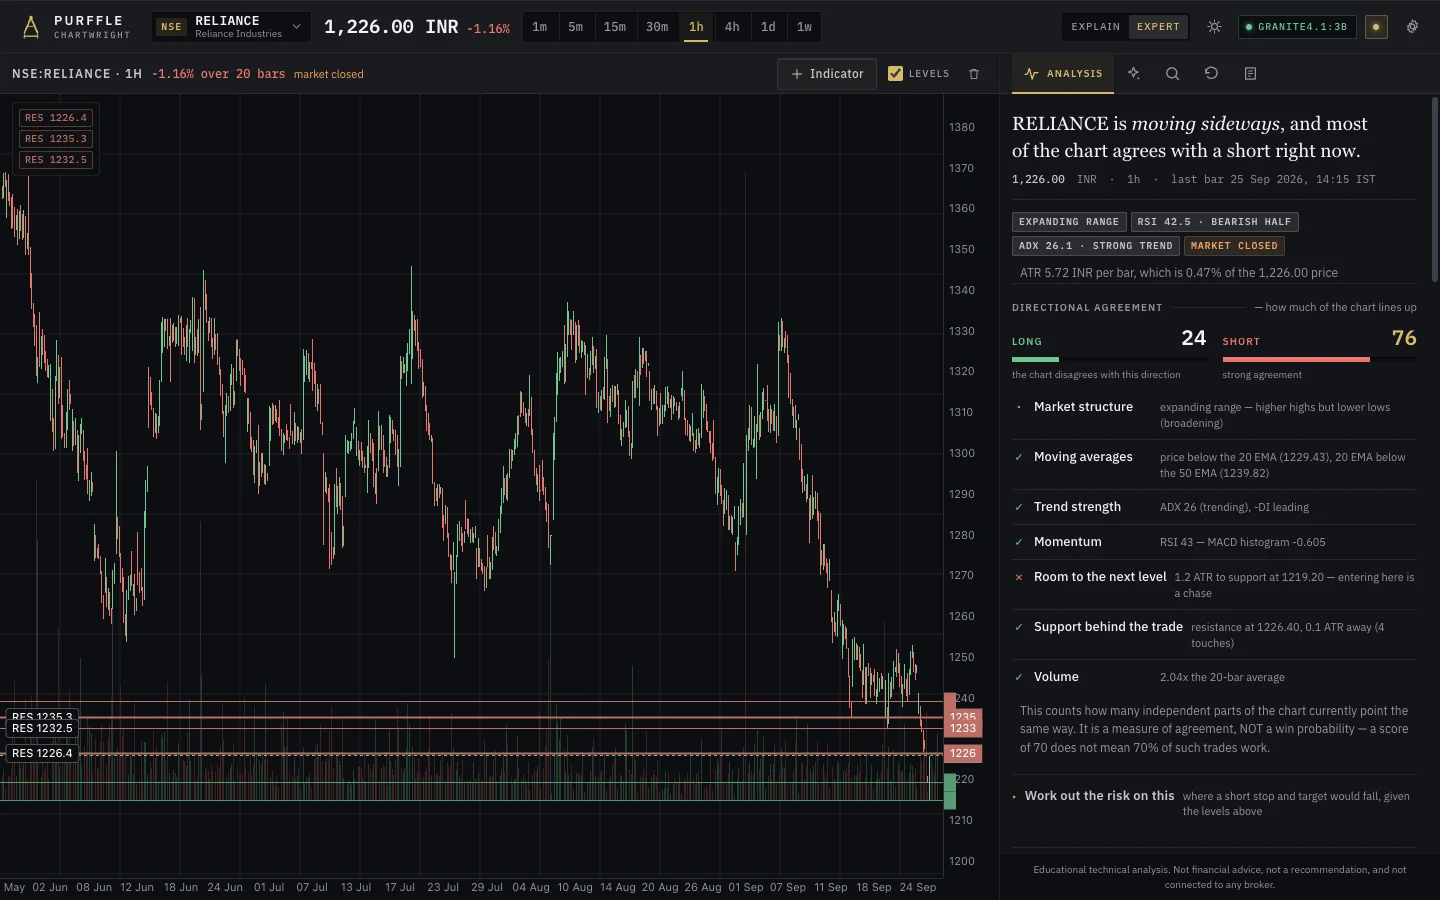
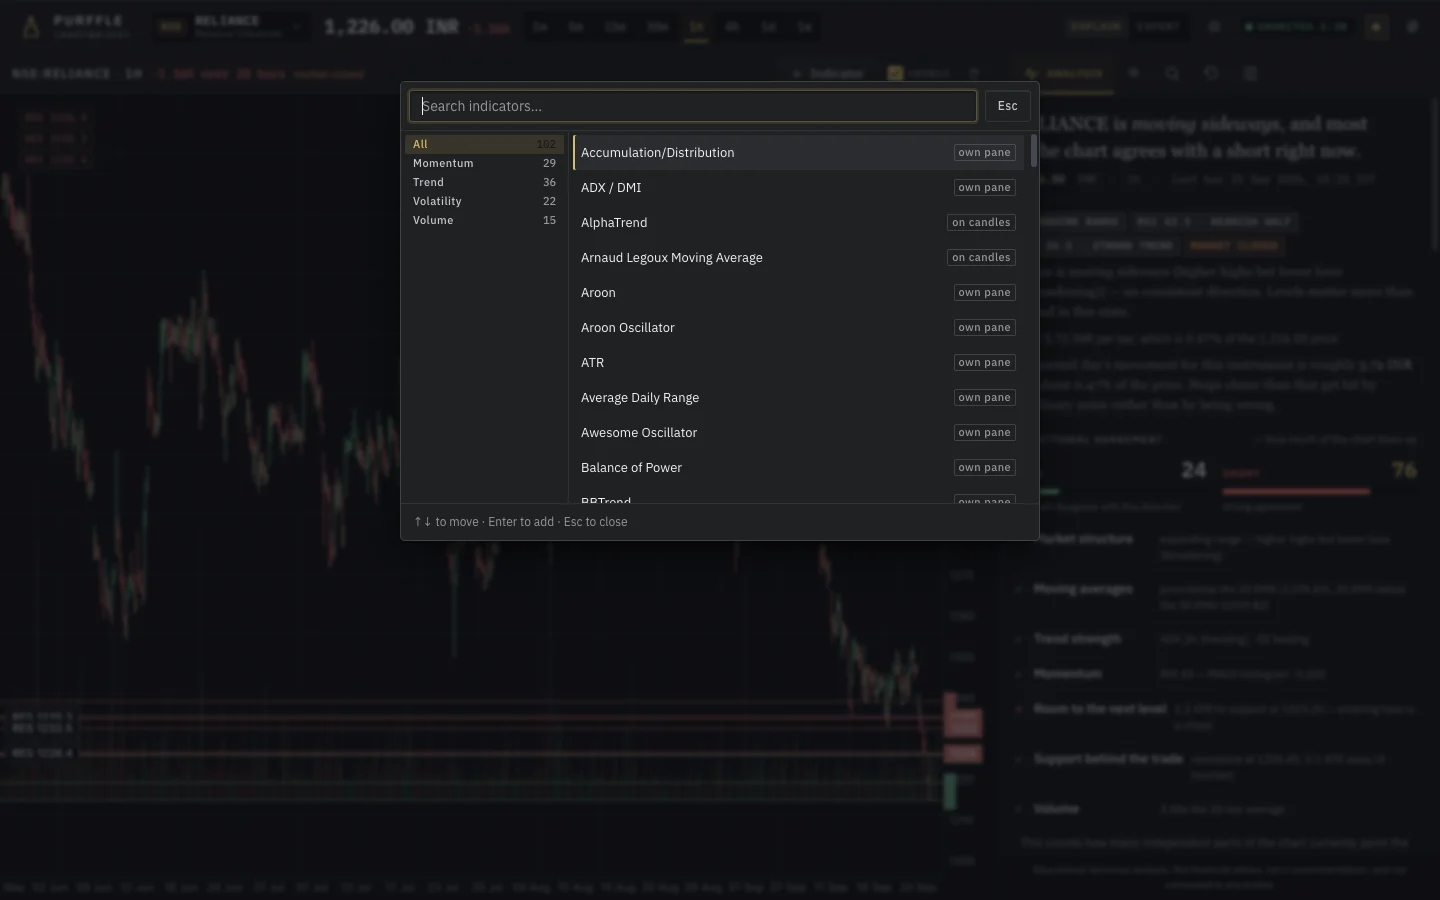
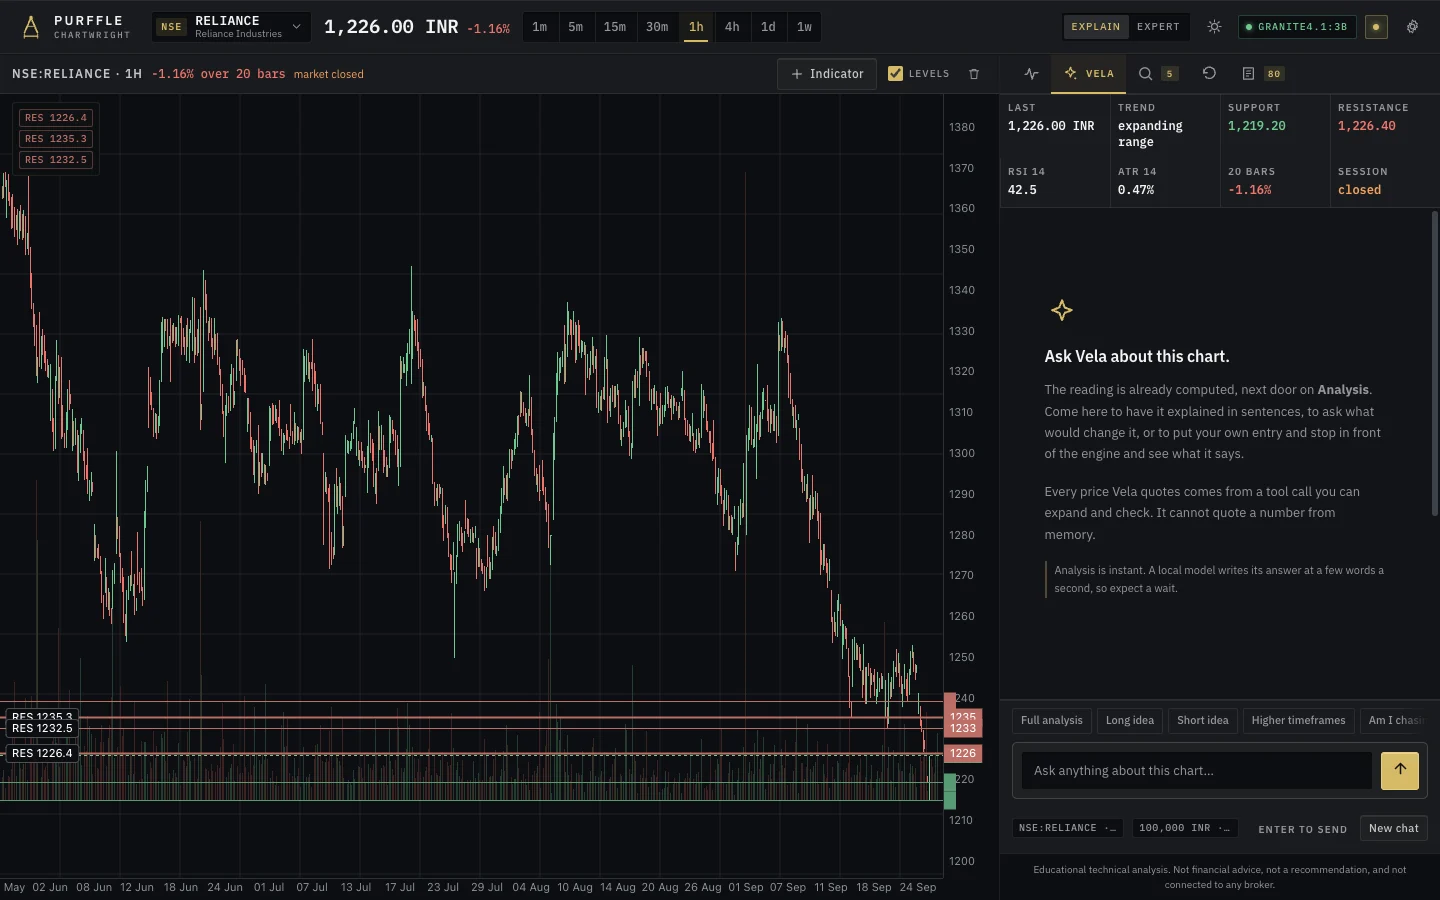
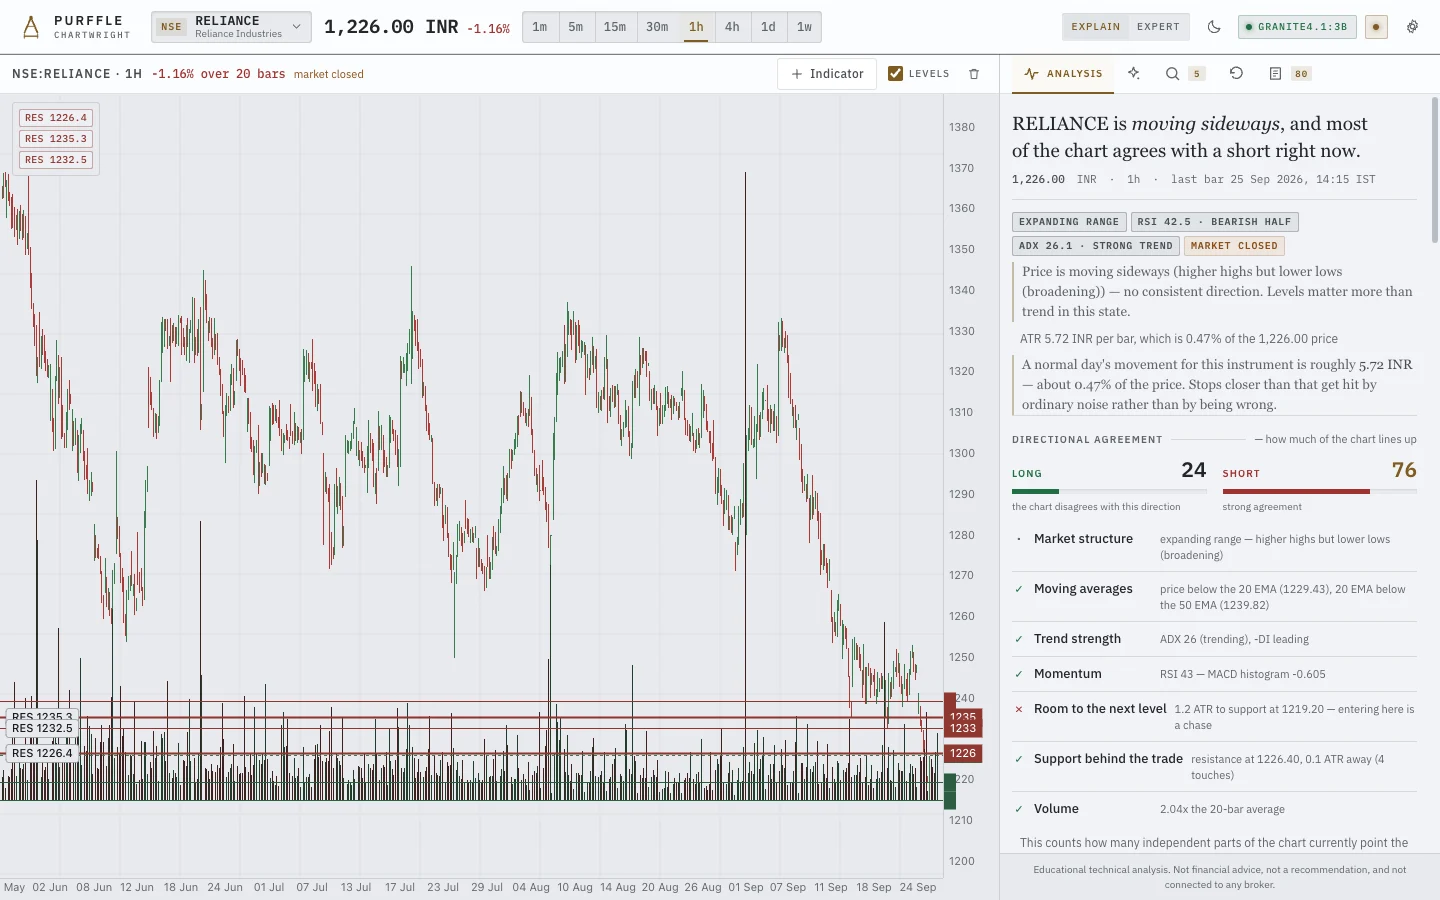
Structure, levels, trend strength and directional agreement — each with one sentence explaining what it means.
02 Features
None of these are bolt-ons. They share one analysis engine, one risk configuration and one unit — R — so a backtest and a journal entry mean the same thing.
Seven independent checks — market structure, moving-average alignment, trend strength, momentum, room to the next level, support behind the trade, and volume — each vote logged with its reason. There is no hidden term.
Touch count, recency and how cleanly price respected each one.
The same instrument read on higher frames, so you see disagreement first.
Beside each ratio, how many times price actually reacted there. Often zero.
Units and money at risk from your account size and risk-per-trade.
Turtle, Donchian, Connors RSI-2, Supertrend, golden cross and more — each labelled published and replicated, published then decayed, folklore, or unknown.
Log entry, stop and target; closed trades score in R so your results and the backtester speak the same unit.
Six markets swept with the same filters a single chart must clear.
Take computed levels to TradingView as a generated indicator.
Ollama locally, or OpenRouter, Anthropic or OpenAI with your own key.
03 How it works
The model always speaks last, and only about numbers the engine produced.
Up to 600 candles on any of eight timeframes, from Yahoo Finance, Binance, or your own broker through OpenAlgo.
Structure, level clusters, trend, volatility, patterns, multi-timeframe agreement and position size — about 0.2 seconds, no language model.
Local through Ollama or with your own key. It reads the computed figures and answers the question you asked — nothing more.
04 The one rule
Ask a chatbot where support is and it will tell you — certain, round, and unattached to your chart. Chartwright computes the structure, levels, volatility and risk arithmetic first. Only then does the model speak, and only about figures it was handed.
“Support sits around 1,360 with strong resistance near 1,400. A stop below 1,350 gives you a good risk-reward here.”
Fluent, confident, and unattached to anything. It never saw a bar.“Support at 1,359.95 — the swing low of 12 Aug, retested four times since, held each time. ATR(14) is 7.03, so a stop there is 2.50 ATR below price.”
Every figure traces to a tool call you can expand: which function produced it, from which bars, in how many milliseconds.05 Explain mode
Explain puts one sentence of plain English under every reading; Expert takes them away. The numbers never change between the two — and none of the sentences is written by the language model. They explain what a reading means, and stop there.
| The reading | What Explain adds under it |
|---|---|
| ADX 13.9 — weak / ranging | ADX measures how convinced the market is, not which way it is going. At 13.9 there is little conviction — price is drifting rather than trending. |
| ATR 21.48 INR · 1.64% | A normal day's movement for this instrument is roughly ₹21.48. Stops closer than that get hit by ordinary noise rather than by being wrong. |
| Agreement 9 / 100, long | 1 of 7 independent checks supports going long. It is a measure of agreement, not a chance of winning. |
| R:R 0.51:1 — rejected | You would be risking ₹32.20 a share to make ₹16.50 at the first target. That is below the 1.5:1 minimum, so the honest answer is that there is no trade here. |
06 Coverage
Type any symbol — the instrument list is a convenience, not a whitelist. If a provider serves it, Chartwright will chart it and analyse it.
| Market | What you get | Where it comes from |
|---|---|---|
| NSE · India | Equities and indices, intraday to weekly. | Yahoo by default, or your own broker through OpenAlgo for real intraday history, MCX and F&O symbols. |
| US equities | Listed stocks and ETFs. | Yahoo Finance. |
| Crypto | Spot pairs, 24/7, no session gaps. | Binance public market data. |
| Forex | Major and cross pairs. | Yahoo Finance. |
| Indices | Global benchmarks. | Yahoo Finance. |
| Commodities | Metals and energy futures. | Yahoo Finance, or MCX through OpenAlgo. |
| 1m → 1w | 1m, 5m, 15m, 30m, 1h, 4h, 1d, 1w — up to 600 bars each. | Whichever provider serves that instrument. No silent resampling. |
07 Measured
One question can be settled without predicting anything: is the price it just told you a price that exists?
This run used small open models running locally — granite4.1:3b, granite4.2:3b, qwen3.5:4b — holding the model fixed and changing only whether the arithmetic was done first.
The question a general assistant gets today: a named chart, and nothing else to work from.
| Asked | Prices given | Checkable | In range, unmatched | Not in the data | Declined to guess |
|---|---|---|---|---|---|
| granite4.1:3b | 6 | 0 | 0 | 6 | 1 of 6 |
| granite4.2:3b | 29 | 9 | 1 | 19 | 0 of 6 |
| qwen3.5:4b | 37 | 18 | 10 | 9 | 1 of 6 |
Identical model, identical question, same machine. Only the computed analysis was added.
| Asked | Prices given | Checkable | In range, unmatched | Not in the data | Declined to guess |
|---|---|---|---|---|---|
| granite4.1:3b | 13 | 13 | 0 | 0 | 0 of 6 |
| granite4.2:3b | 13 | 13 | 0 | 0 | 0 of 6 |
| qwen3.5:4b | 12 | 12 | 0 | 0 | 0 of 6 |
The shipping application: the engine runs, the model calls tools, the answer comes back.
| Asked | Prices given | Checkable | In range, unmatched | Not in the data | Declined to guess |
|---|---|---|---|---|---|
| Purffle Chartwright | 82 | 82 | 0 | 0 | 0 of 6 |
It is a small run — three instruments (NSE:RELIANCE 15m, BINANCE:BTCUSDT 1h, AAPL 1d), two questions each — and it measures one property.
It says nothing about whether any tool makes money. It is not a comparison against frontier models: GPT, Claude and Gemini were not tested, and nothing here is a result about them.
"Declined to guess" is scored as correct. The harness, scoring rules and raw answers ship in the application folder as scripts/benchmark.py.
08 Before you download
A page that only lists strengths is an advertisement. None of this is going to change in a later version, because none of it is a bug.
Nothing here forecasts price. It describes what the chart has already done, computes what the levels imply arithmetically, and tells you when the evidence disagrees with itself.
It cannot place, modify or cancel an order, and it never will. The optional OpenAlgo connection is read-only market data.
Earlier builds volunteered an entry, a stop and two targets on every chart. That was wrong and it is gone. The arithmetic exists behind a disclosure you open on purpose.
Minutes per answer on four cores without a GPU — measured. The chart, analysis, screener and backtester are instant regardless.
Grounding fixes the numbers, not the judgement. It can still draw a poor conclusion from figures that are all correct — and so can you.
Yahoo history can be delayed, gapped or adjusted. Chartwright flags stale and forming bars where it can detect them.
09 Compare
The nearest comparable product is TradingView Remix. It is a good product and does several things this does not. Both descriptions come from its own published material.
| Purffle Chartwright | TradingView Remix | |
|---|---|---|
| Where levels come from | A deterministic Python engine, from real swing pivots. The model is never given raw bars. | A language model reading chart context, via OpenRouter models including Claude, automatically selected. |
| Speed of the analysis | About 0.2 seconds, no model involved. | Every answer is a model round trip. |
| Market data | Free delayed data from Yahoo and Binance, or your broker through OpenAlgo. | TradingView's real-time data through your account. Better than ours. |
| Account required | None. It runs on your machine. | A TradingView account; weekly usage capped by plan. |
| Can it place orders | No, by design. No broker connection at all. | Paper trading with market, limit and stop orders. |
| Changing the chart by asking | The symbol only, deliberately. | More than we do: symbols, timeframes, indicators, layouts. |
| Stated accuracy | The benchmark below, with the harness in the box. | No published accuracy claim that we could find. |
Sourced from the Chrome Web Store listing and tvremix.xyz, read on 7 September 2026. We have not driven Remix ourselves: it needs a TradingView account, and automating it would breach TradingView's terms.
10 Watch · 3 min
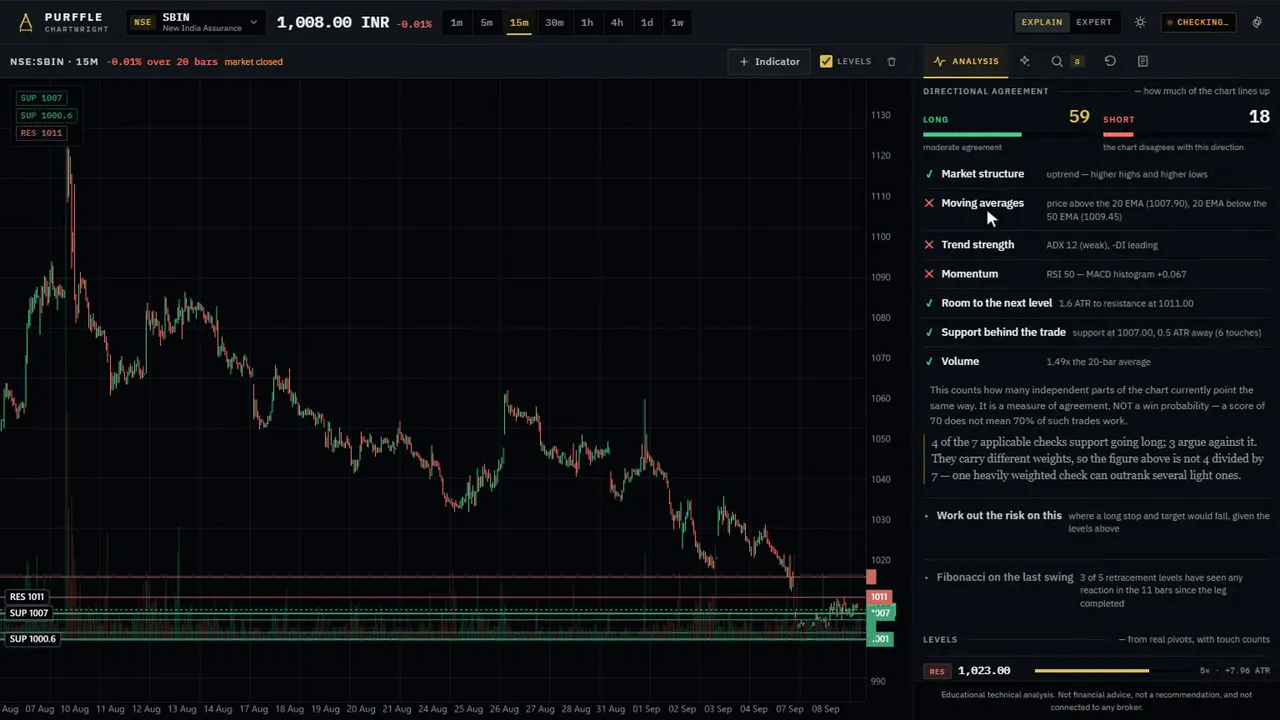
A three-minute narrated tour, recorded in the app on NSE:SBIN: the question, the computed answer, Explain mode, the tools, and an honest comparison with TradingView Remix.
11 Download · v1.0
The app bundles its own runtime and engine — download, run, and point it at a chart. No model is bundled; add one from inside the app (2–6 GB, optional) or use your own key.
SmartScreen notice? Click More info → Run anyway.
Beta: built and run on one Intel Mac so far. Apple Silicon Macs need Rosetta. Not code-signed — if macOS blocks it, run xattr -cr "/Applications/Purffle Chartwright.app".
The Linux build is in final testing. Check back soon.
The model has no access to raw bars — it can only call tools, and every tool returns values computed by the engine. And every answer keeps its receipts: the tools that ran, what each returned and how long it took, shown on demand.
For market data, yes. For the assistant, no, if you install a local model — then nothing about your charts, questions, journal or notes leaves the machine.
No, and it is built so that it cannot. There is no order path in the application. The optional OpenAlgo connection is read-only market data.
Private and free: granite4.1:3b locally — the fastest to a fully grounded answer of everything tested. Fast: any hosted model through your own key. The analysis underneath is identical either way.
The chart, analysis, screener, backtester and journal run comfortably on any machine from the last decade with 8 GB of RAM. A local model is the demanding part: minutes per answer on a laptop CPU, seconds with a GPU or hosted model.
A beta for Intel Macs, built and run on one Intel Mac so far. Apple Silicon Macs need Rosetta. A Linux build is in final testing.
All six markets go through the same engine: NSE India, US equities, crypto, forex, indices and commodities.
No. It is educational technical analysis software. It describes charts and does arithmetic on levels. Every trading decision you make is yours.
13 Guides
Straight answers to the questions people search for — including the limitations.
What a published test found about AI and prices, and five questions to ask any AI chart tool.
Read guideSwing pivots, touch counts, ATR, reward-to-risk and ADX — what each reading means, with worked numbers.
Read guideA desktop chart analyst that computes every number before it says one. Free for Windows.